 now
also ... simply runs in your browser! Yes, skip (1) (2) (3) and
directly hop to (4) when using
the mybinder.org service . Wow, so cool.
now
also ... simply runs in your browser! Yes, skip (1) (2) (3) and
directly hop to (4) when using
the mybinder.org service . Wow, so cool.Step 1 is for Linux. For other systems, look here.
Newsflash:  now
also ... simply runs in your browser! Yes, skip (1) (2) (3) and
directly hop to (4) when using
the mybinder.org service . Wow, so cool.
Create and start the venv (virtual environment) to keep your main installation of python unaffected; then upgrade the `pip` package installer, and install the `wheel` binary packaging standard, then the `pandas` data structures, and the `jupyter` notebook interface and its kernel, which you register as "py3sciencekernel". Finally, start the jupyter server ...
 python3 -m venv ./py3science

        source ./py3science/bin/activate
 pip3 install -U pip wheel

        pip3 install pandas jupyter ipykernel
 ipython kernel install --user --name="py3sciencekernel"

        jupyter notebook
... and wait until the browser shows you http://localhost:8888
py3sciencekernelrisklayer-data-analysis-v01In[ ] input line ... try it out
... type this:[ 42**i for i in range(42) ]Input this to get the risklayer.com dataset, and show their 3 info lines
import pandas

        url_RL =
        "http://risklayer-explorer.com/media/data/events/GermanyValues.csv"

        df = pandas.read_csv(url_RL)


        attribution = df[ pandas.isna( df["ADMIN"]) ]

        print ( "\n".join(attribution["AGS"].values) )
and again <Shift> <Enter>.
Now explore the DataFrame. For example, here's a simple-statistics summary:
df.describe()
or e.g. sum all the numerical rows
df.sum()
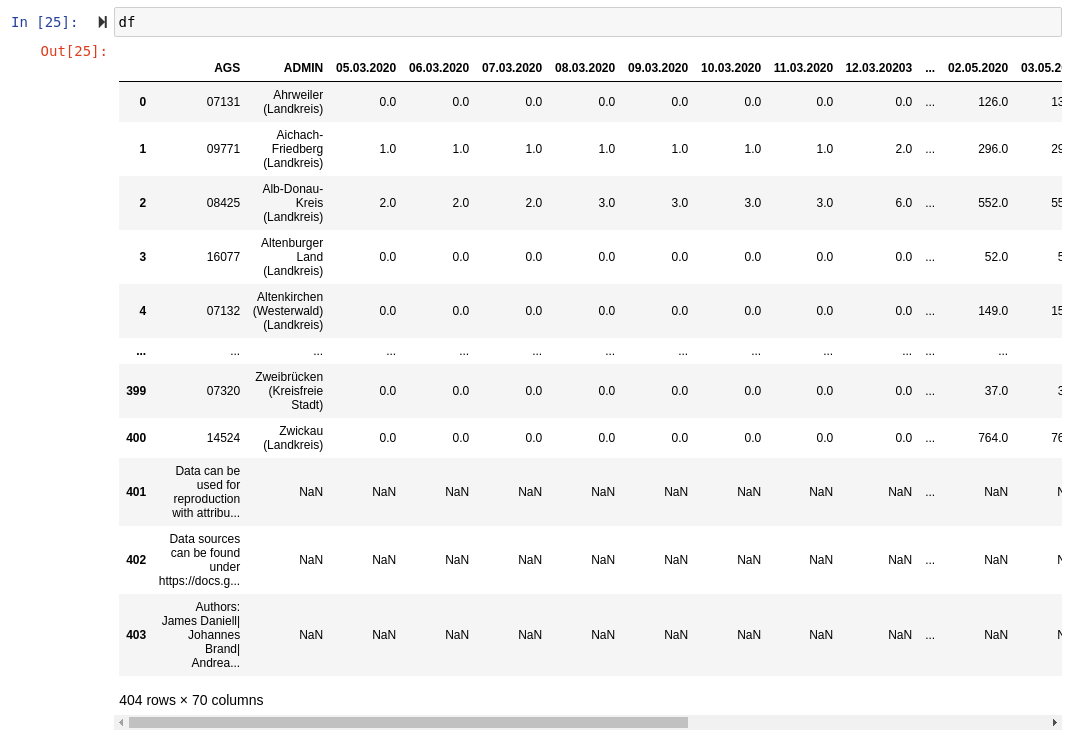
or look at the whole table
df

I recommend looking into pandas and matplotlib. Have fun. If interesting, I would like to learn what you find out. Later, perhaps we can include your analysis into cov19de somehow?
Once you have created interesting insights into that dataset, simply raise an issue to contact me please.